Model Architecture
Model Structure
The AETOS model builds on the OSeMOSYS framework to provide a transparent, open-source tool for cross-continental energy system analysis. Its design philosophy emphasizes reproducibility, comparability across regions, and scalability from national to continental level.
Framework & Philosophy
Fully based on the OSeMOSYS open-source modeling framework.
Emphasis on transparency, open data, and reproducibility.
Designed for multi-regional, long-term scenario exploration.
The diagram below shows the AETOS input–output structure, linking key datasets to model outputs:
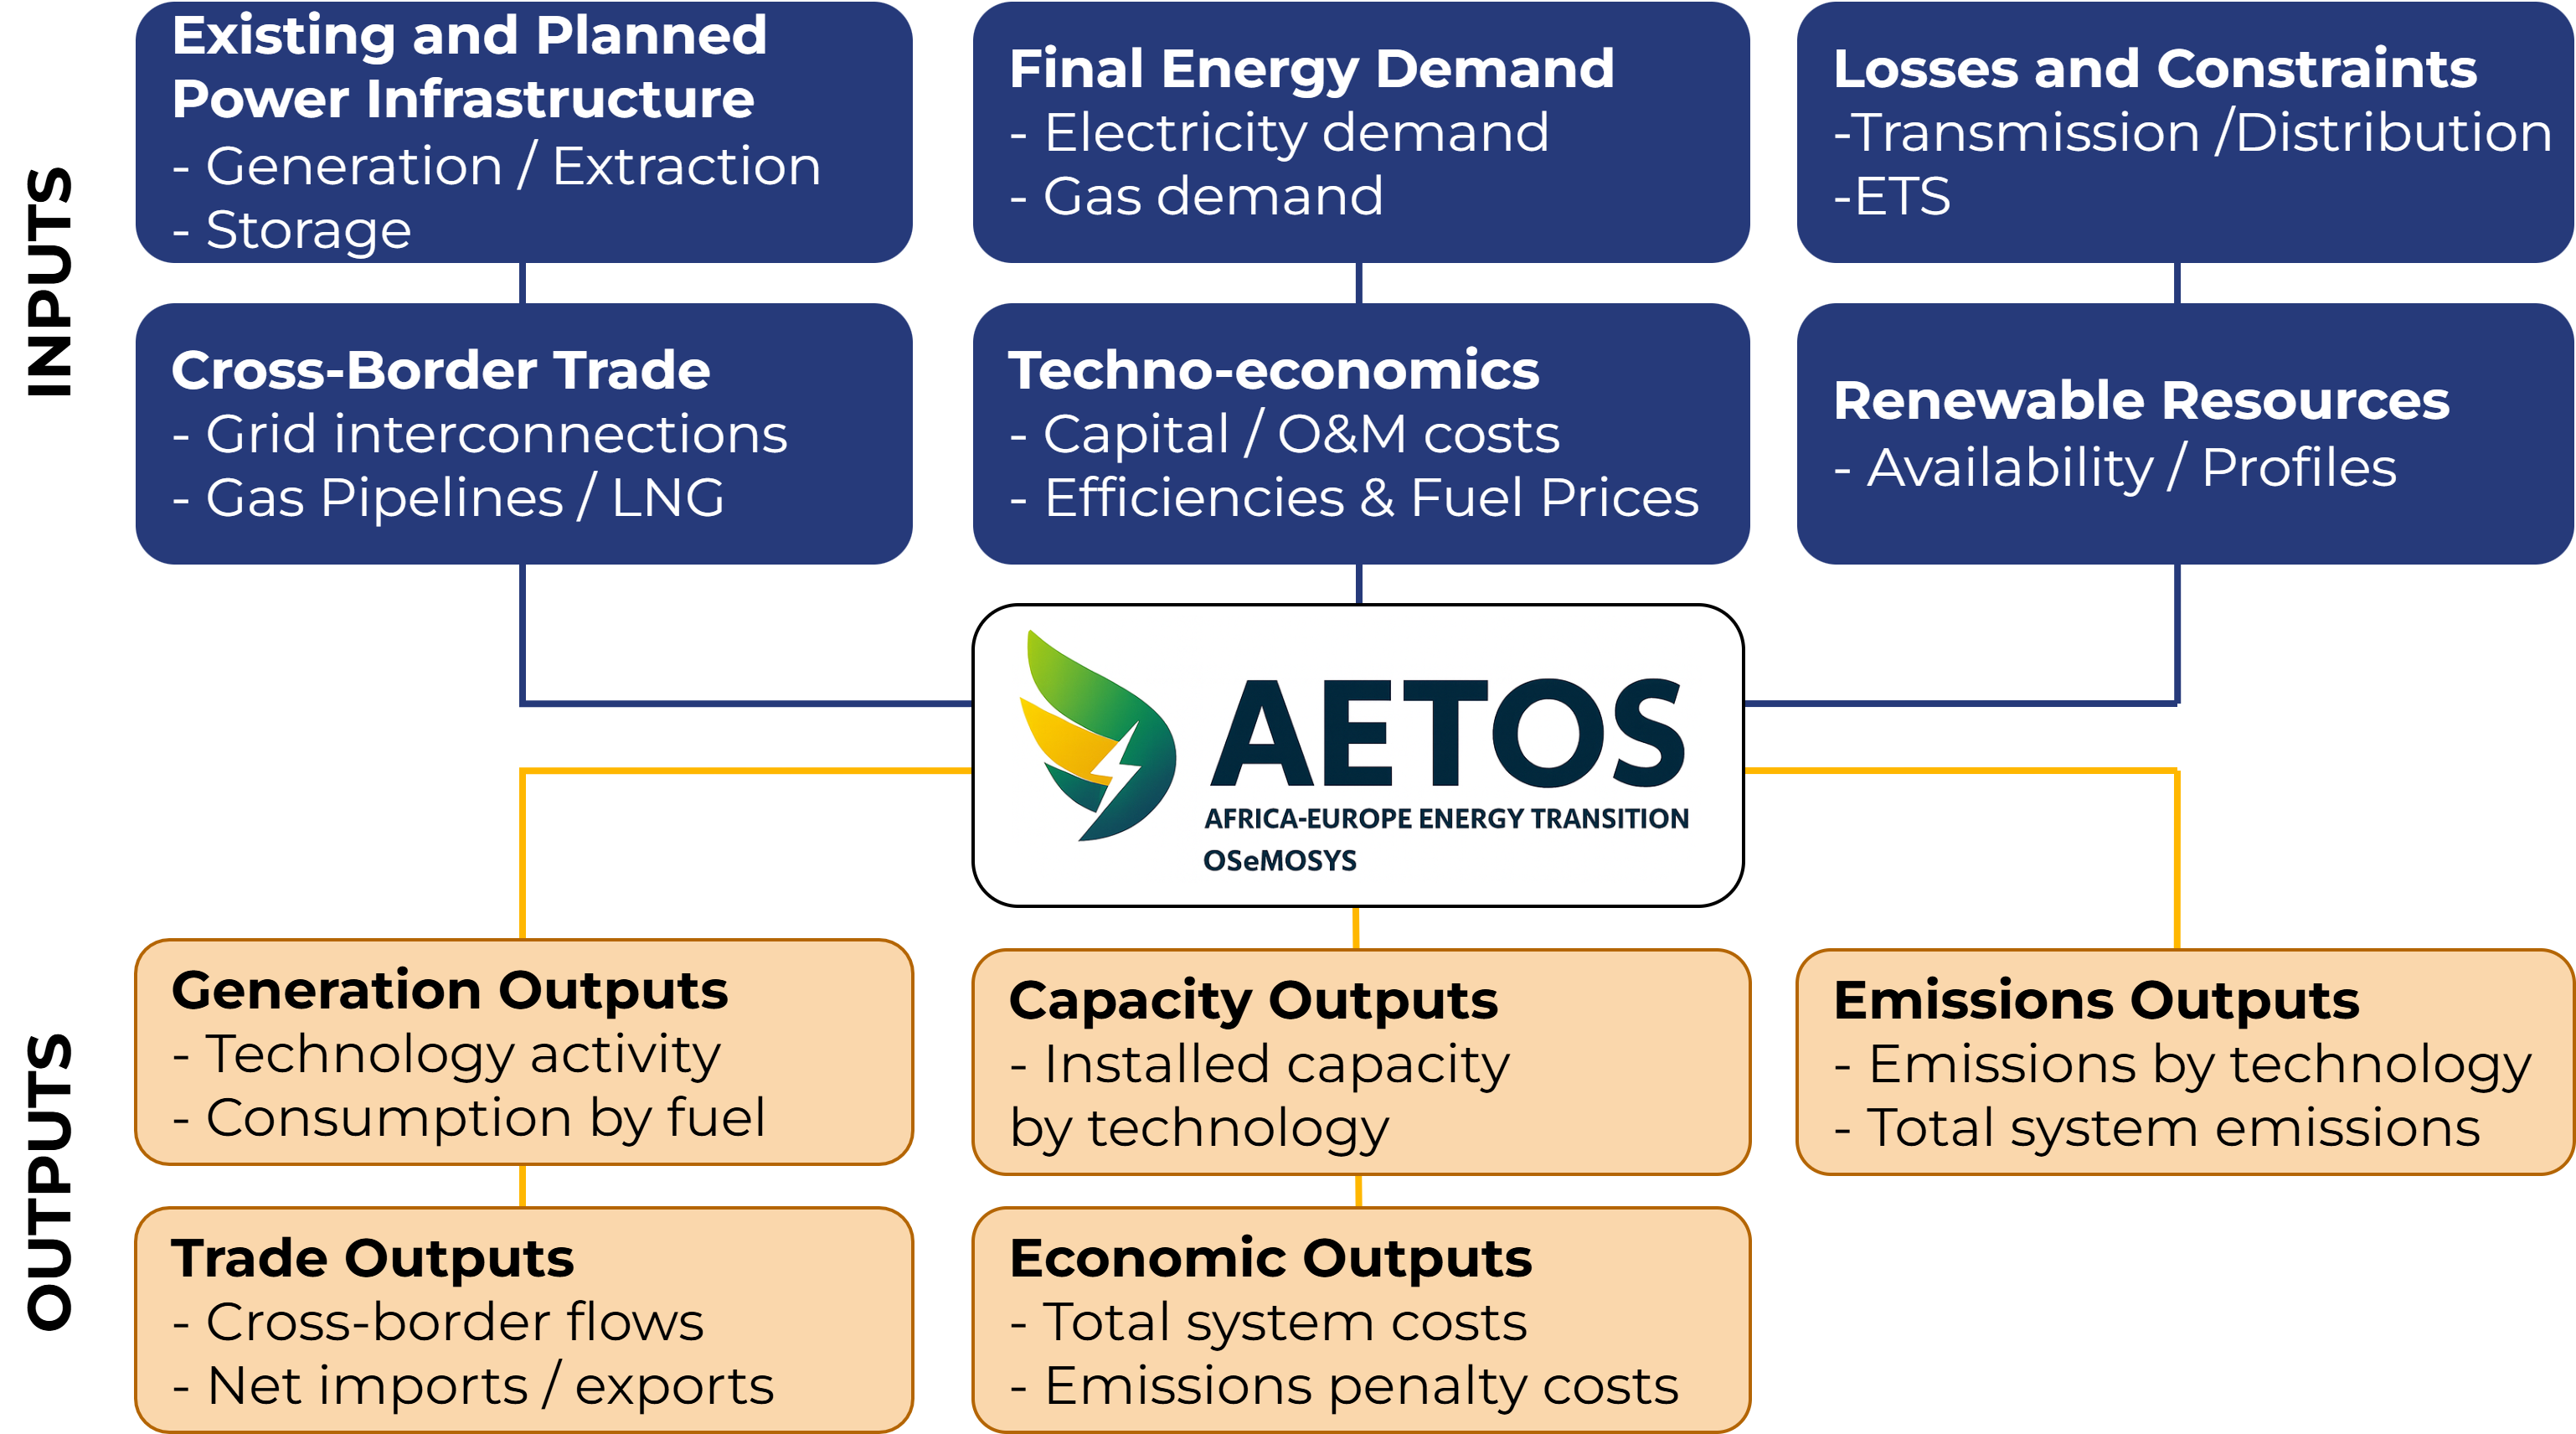
Figure 1. AETOS Input Output.
Regions & Countries
AETOS covers 78 countries across Africa and Europe, with each country modeled individually.:
Africa (48)
Country |
ISO |
|---|---|
Algeria |
DZ |
Malawi |
MW |
Angola |
AO |
Mali |
ML |
Benin |
BJ |
Mauritania |
MR |
Botswana |
BW |
Morocco |
MA |
Burkina Faso |
BF |
Mozambique |
MZ |
Burundi |
BI |
Namibia |
NA |
Cameroon |
CM |
Niger |
NE |
Central African Rep. |
CF |
Nigeria |
NG |
Chad |
TD |
Rwanda |
RW |
Côte d’Ivoire |
CI |
Senegal |
SN |
Djibouti |
DJ |
Sierra Leone |
SL |
DR Congo |
CD |
Somalia |
SO |
Egypt |
EG |
South Africa |
ZA |
Equatorial Guinea |
GQ |
South Sudan |
SS |
Eritrea |
ER |
Sudan |
SD |
Eswatini |
SZ |
Tanzania |
TZ |
Ethiopia |
ET |
Togo |
TG |
Gabon |
GA |
Tunisia |
TN |
Gambia |
GM |
Uganda |
UG |
Ghana |
GH |
Zambia |
ZM |
Guinea |
GN |
Zimbabwe |
ZW |
Guinea-Bissau |
GW |
Kenya |
KE |
Lesotho |
LS |
Liberia |
LR |
Libya |
LY |
Europe (30)
Country |
ISO |
|---|---|
Austria |
AT |
Lithuania |
LT |
Belgium |
BE |
Luxembourg |
LU |
Bulgaria |
BG |
Latvia |
LV |
Switzerland |
CH |
Malta |
MT |
Cyprus |
CY |
Netherlands |
NL |
Czechia |
CZ |
Norway |
NO |
Germany |
DE |
Poland |
PL |
Denmark |
DK |
Portugal |
PT |
Estonia |
EE |
Romania |
RO |
Spain |
ES |
Sweden |
SE |
Finland |
FI |
Slovenia |
SI |
France |
FR |
Slovakia |
SK |
Greece |
GR |
United Kingdom |
UK |
Croatia |
HR |
Hungary |
HU |
Ireland |
IE |
Italy |
IT |
Technologies & Fuels
The AETOS model represents 3,283 technologies, spanning all major fuels and system components.
Category |
Fuels |
|---|---|
Fossil |
Coal, Lignite, Natural Gas, Fuel Oil / Heavy Fuel, Light Fuel, Diesel Oil, Refinery Gas, Derived Gas |
Renewables |
Solar, Wind, Hydropower, Biomass, Geothermal, Tidal, Ocean/Wave, Waste |
Secondary / Vectors |
Nuclear, Battery, Electricity |
Temporal Resolution
Horizon: 2021–2060 (yearly time steps).
Intra-annual resolution: 16 time-slices (4 seasons × 4 daily periods), ensuring seasonal and daily demand peaks are fully captured.
Seasons (S)
Code |
Season |
Days |
|---|---|---|
S1 |
Winter |
90 |
S2 |
Spring |
92 |
S3 |
Summer |
92 |
S4 |
Autumn |
91 |
Total |
365 |
Daily parts (P)
Code |
Start (h) |
End (h) |
Duration (h) |
|---|---|---|---|
P1 |
0 |
7 |
7 |
P2 |
7 |
17 |
10 |
P3 |
17 |
21 |
4 |
P4 |
21 |
24 |
3 |
Total |
24 |
System Design
Reference Energy System
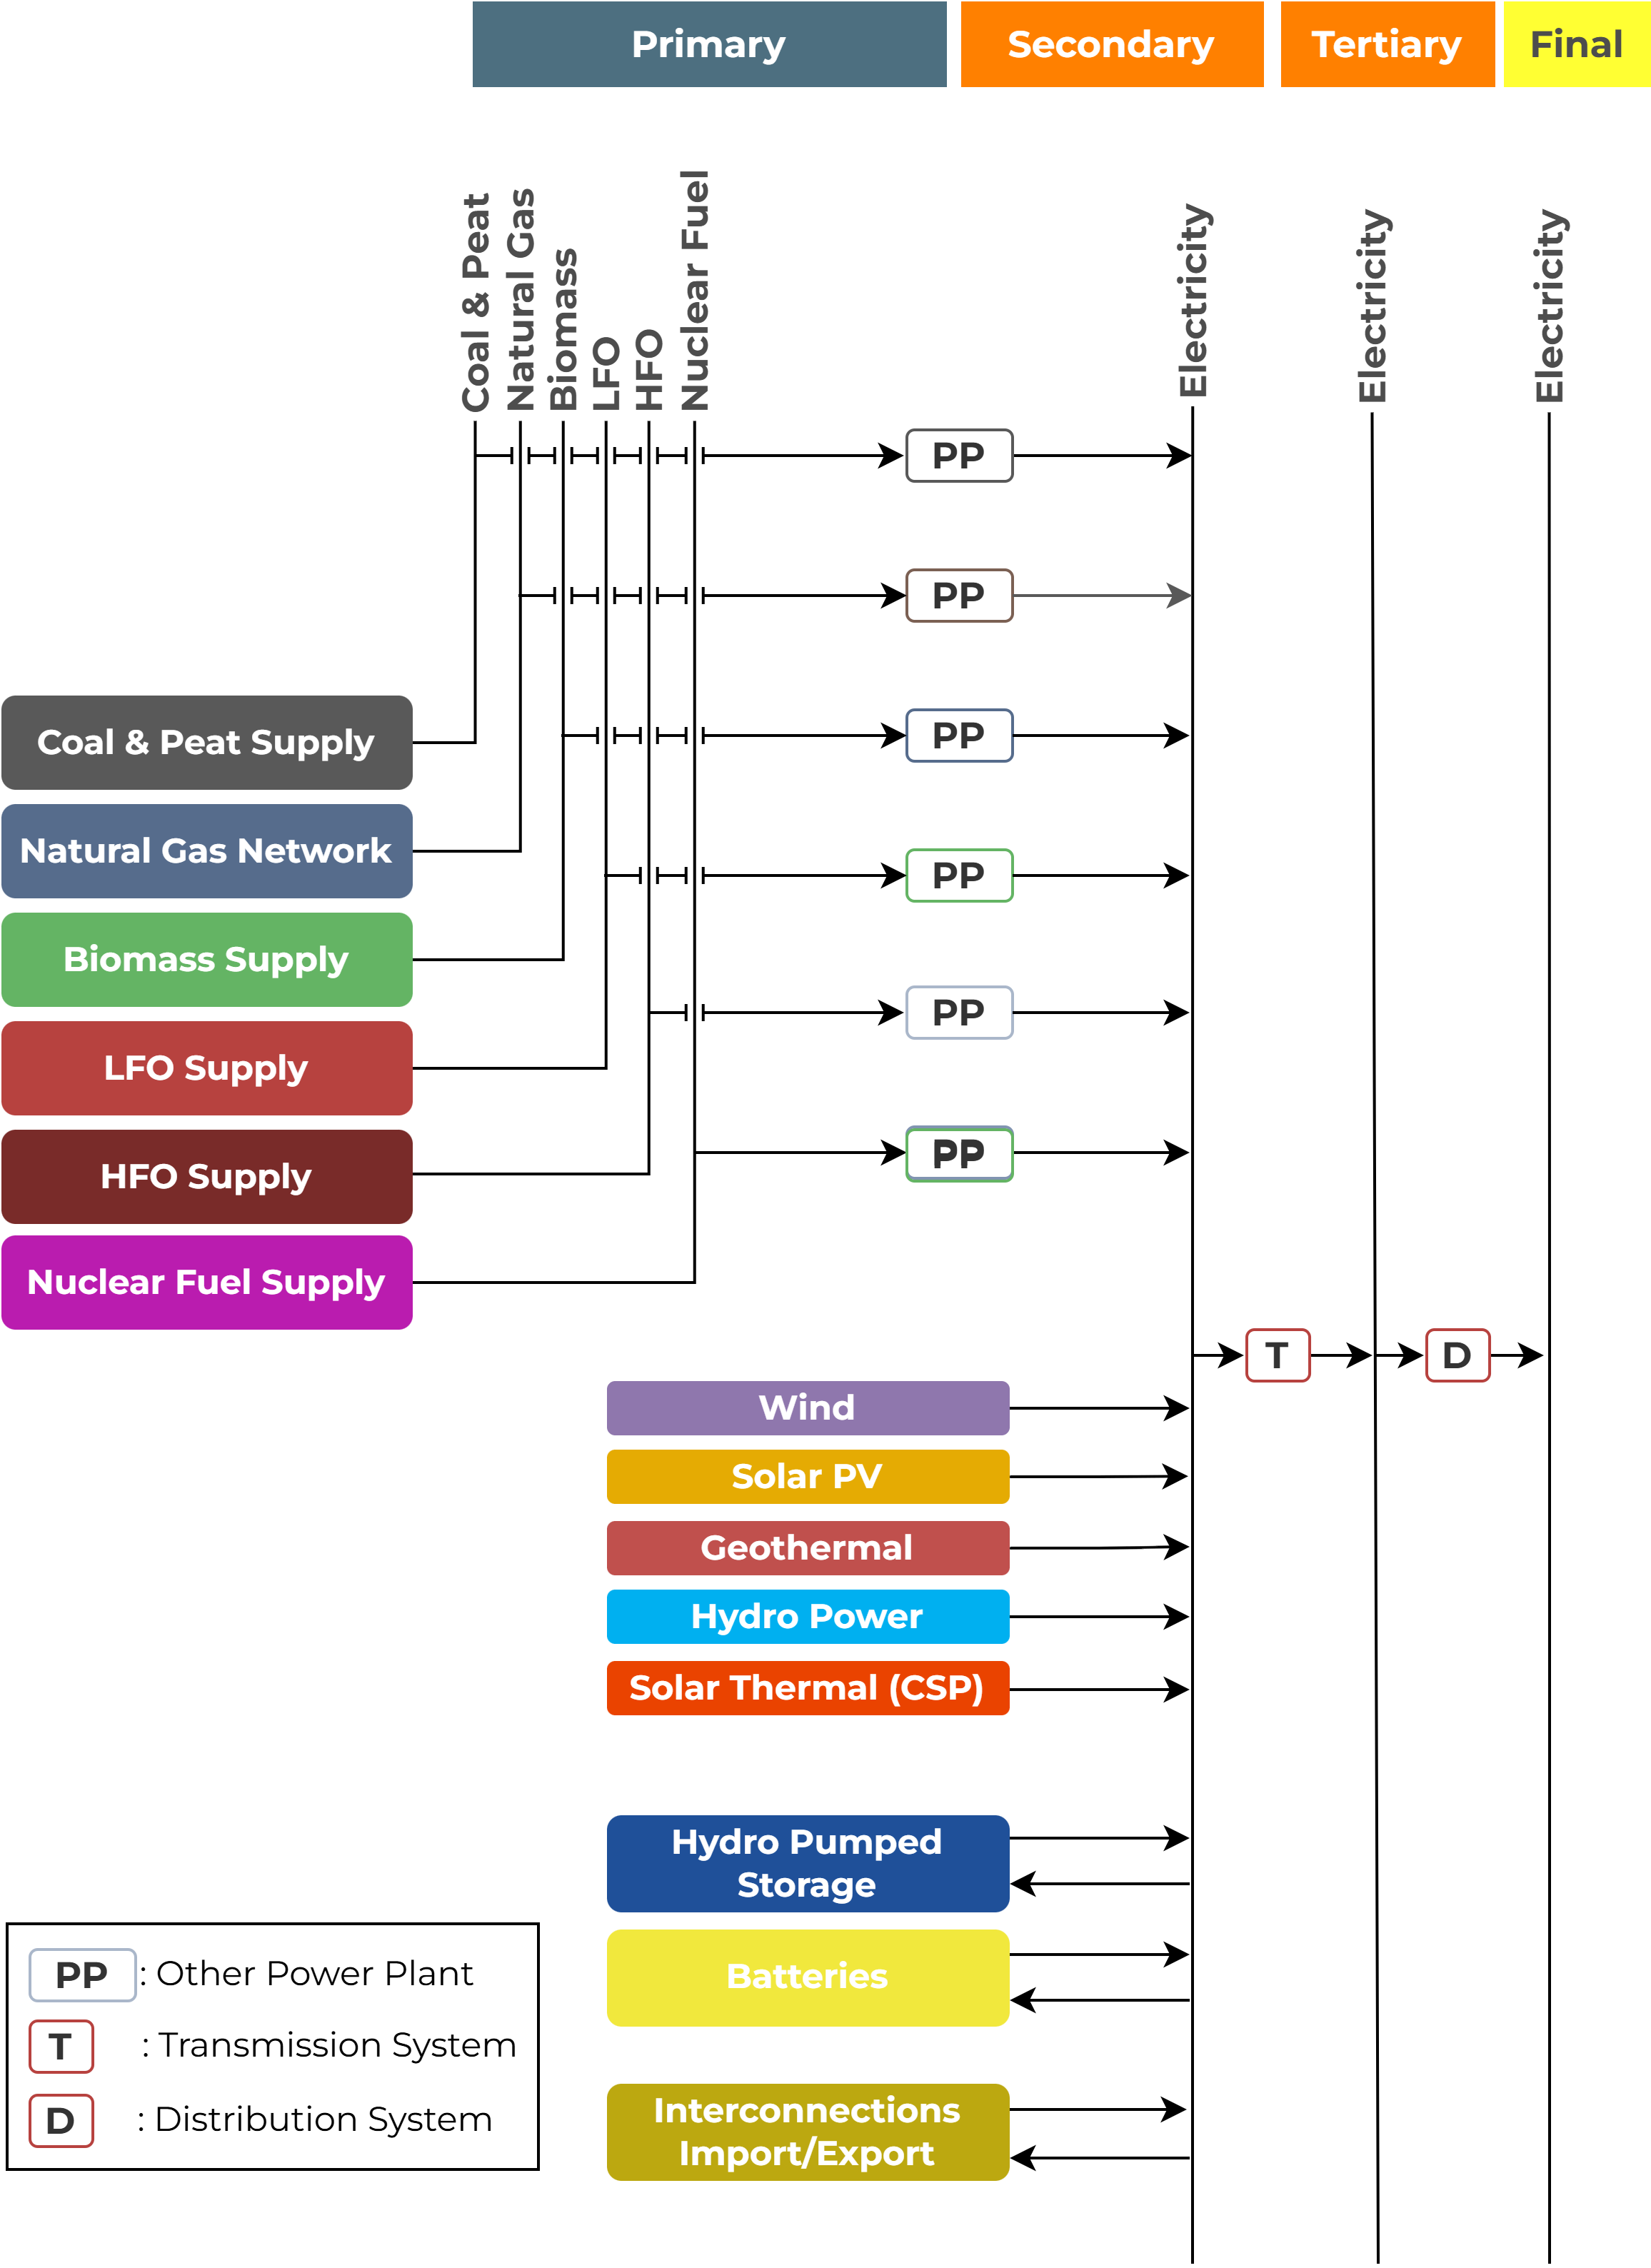
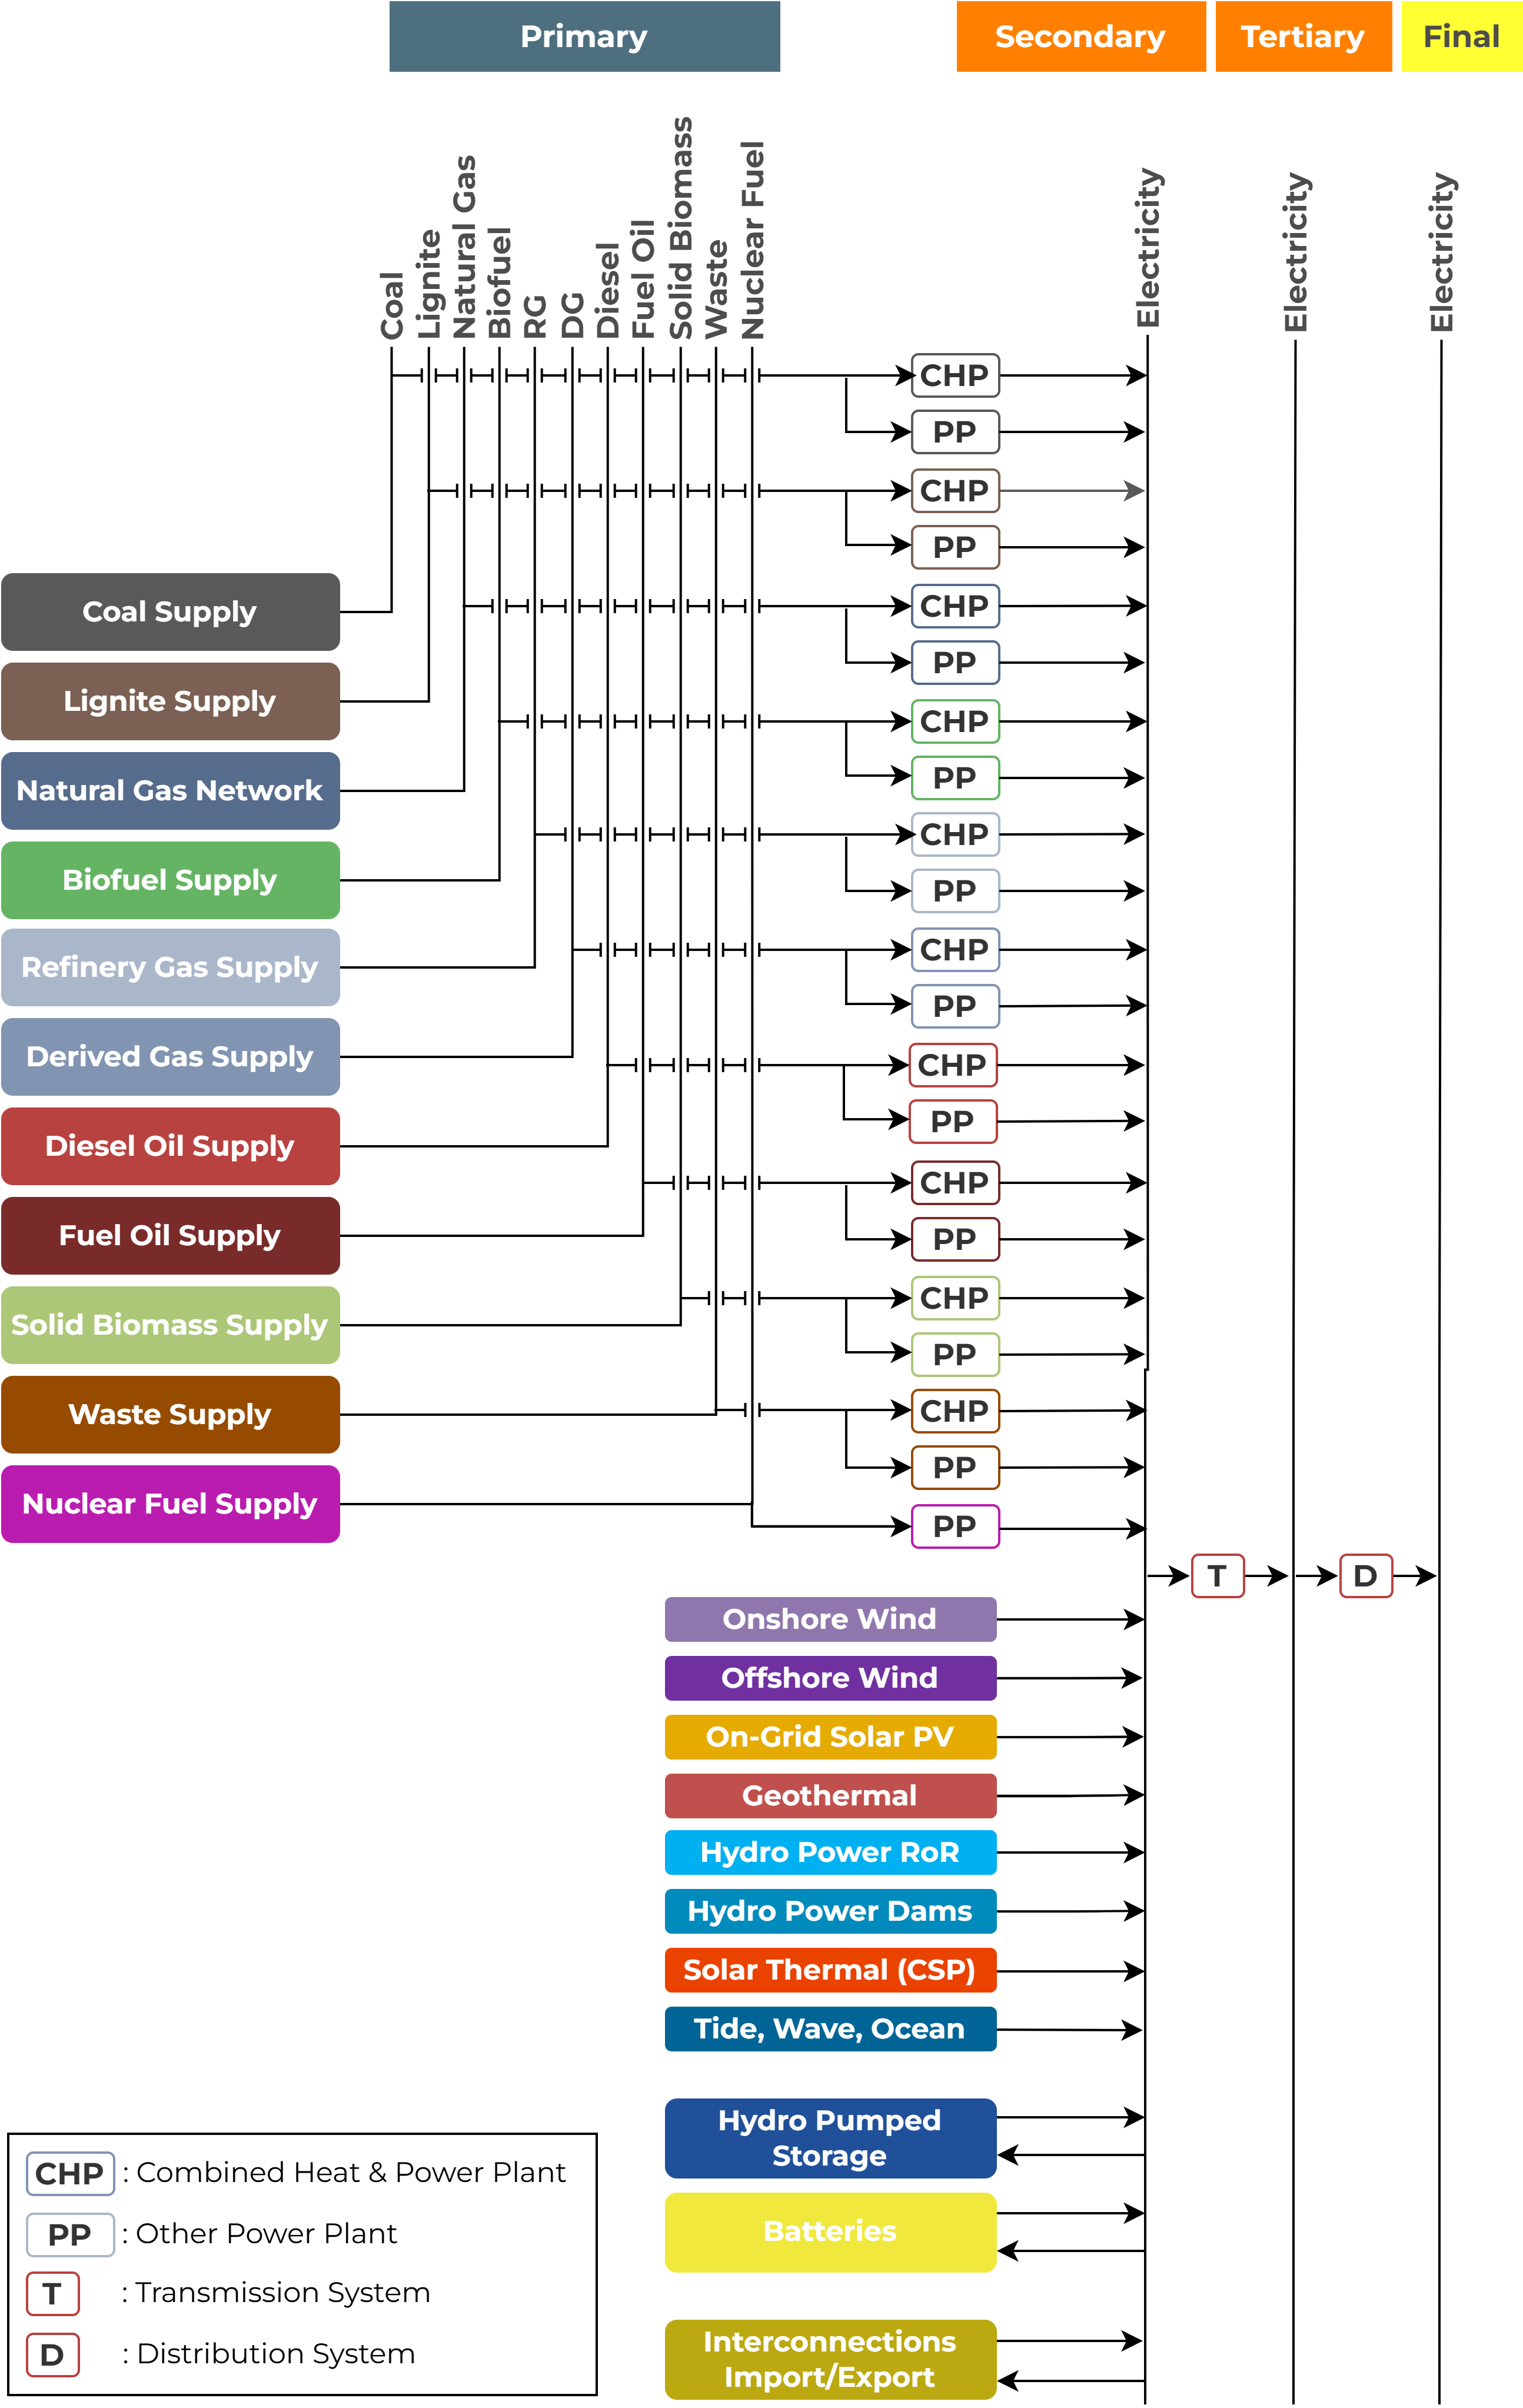
These Reference Energy Systems (RES) provide a schematic view of how energy resources, technologies, and demand sectors are connected within the model. They illustrate flows from primary resources (fossil, renewable, imports) through conversion technologies (power plants, trade infrastructure, storage) to meet final electricity and gas demand.
|
|
Figure 2. Reference Energy System – Africa (left) and Europe (right).
Interconnection Structure
The model represents electricity interconnections explicitly. Each link between two countries is modeled as a bidirectional interconnector with two modes:
Mode 1: Power flow from Country 1 → Country 2
Mode 2: Power flow from Country 2 → Country 1
This structure allows detailed accounting of imports, exports, and trade balances, while consistently linking power plants, demand, and regional grids.
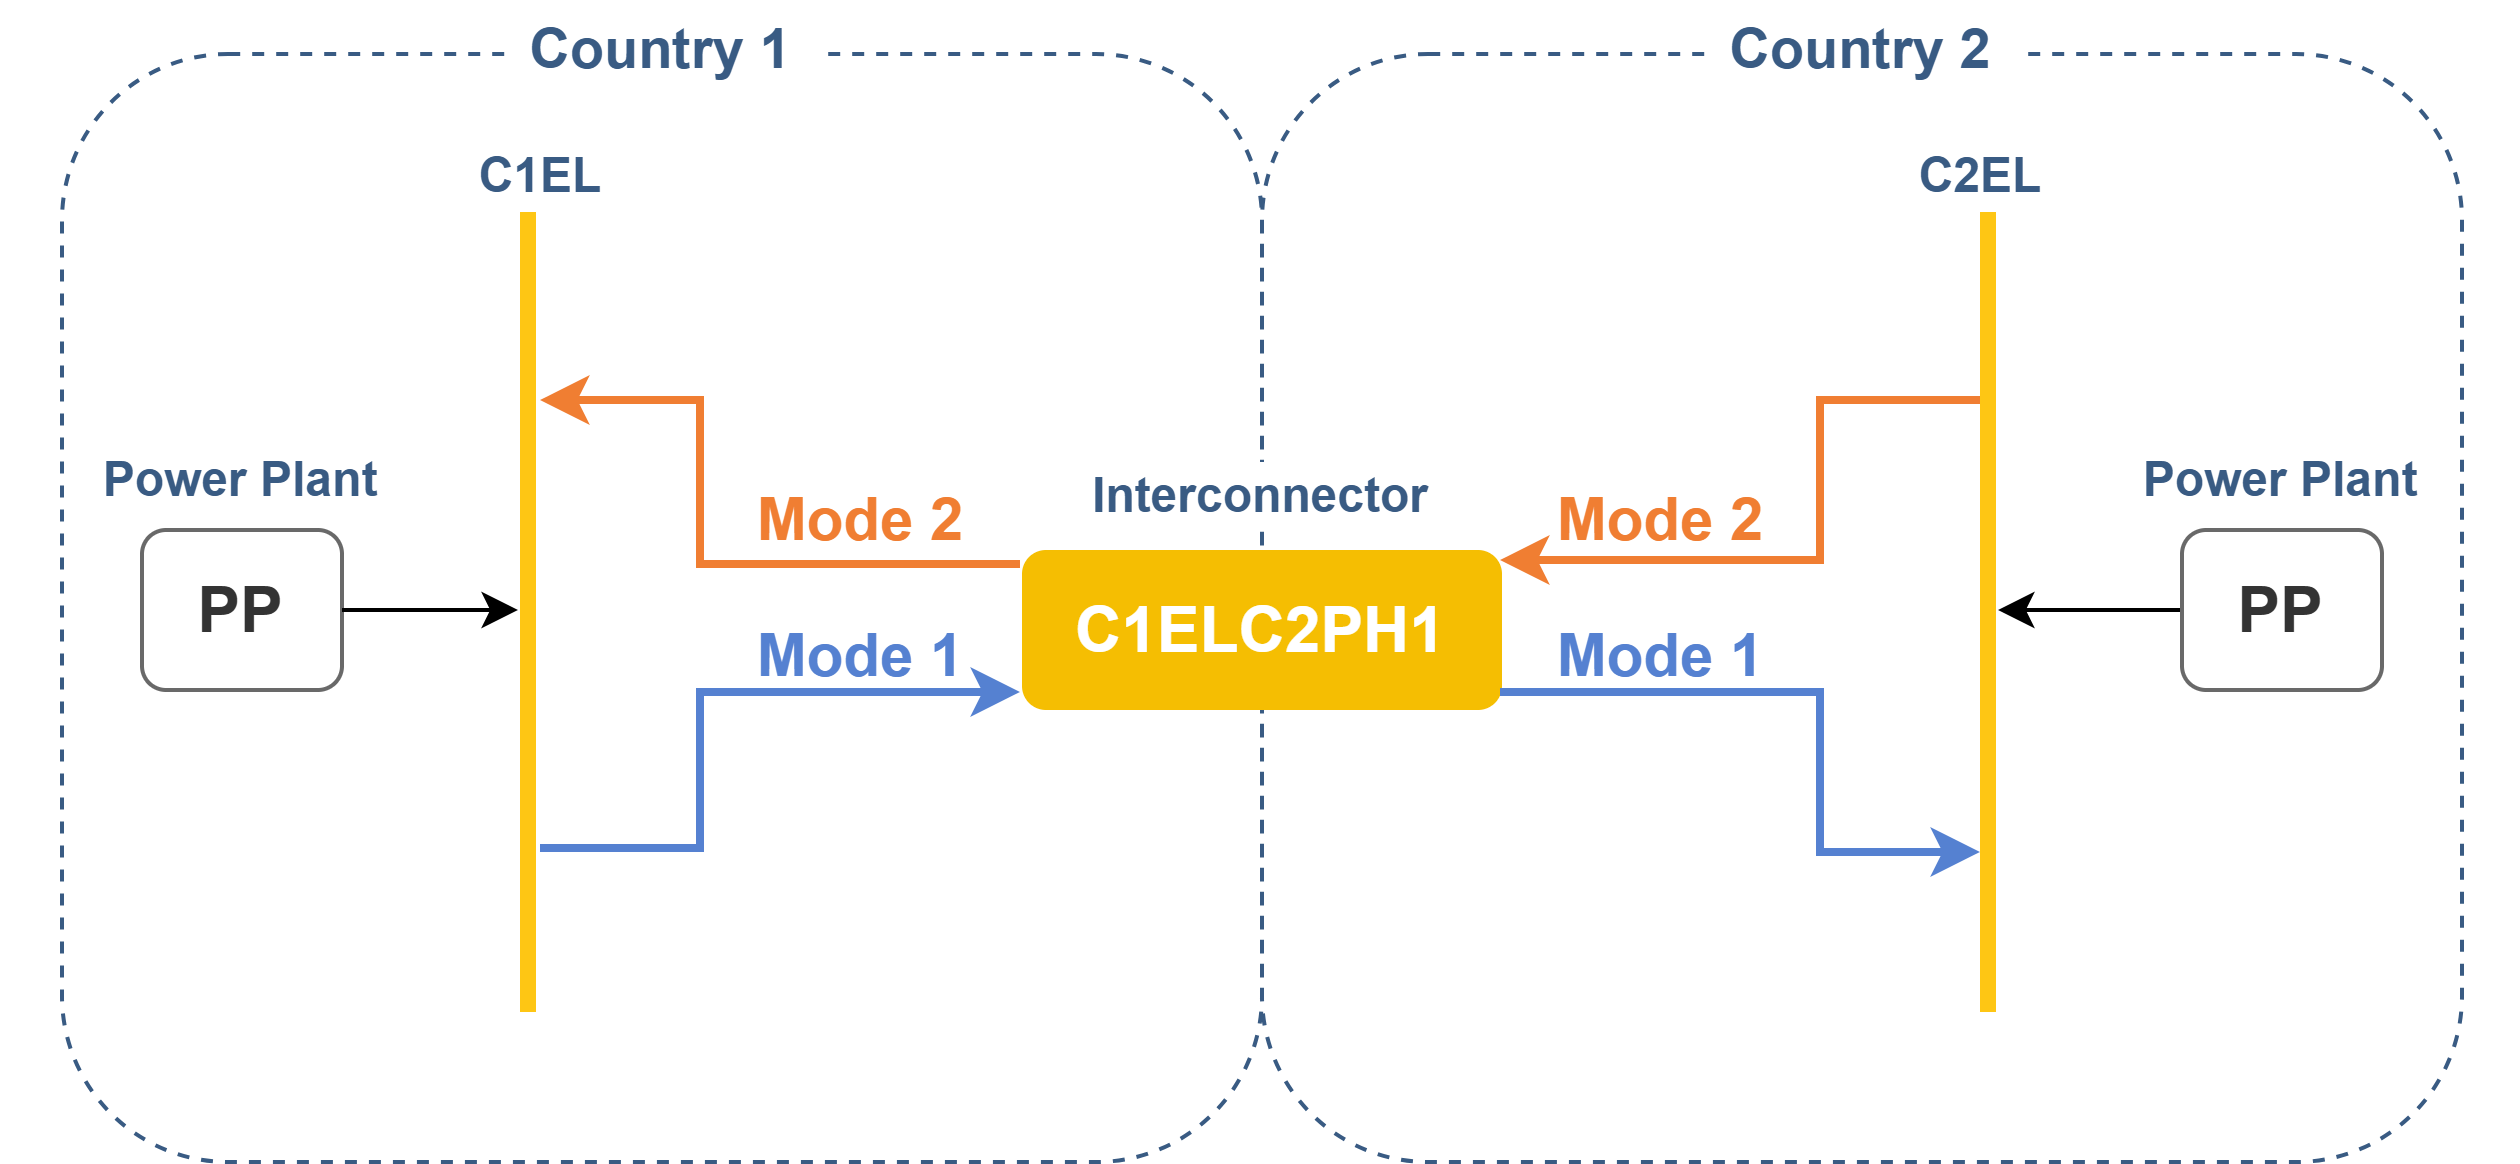
Figure 3. Interconnection architecture between African and European regions.
Storage Structure
The model represents storage explicitly by separating technology operation and storage content into two linked components:
STOR_T (Technology): governs charging and discharging of energy.
STOR_S (Storage): tracks stored energy across time periods.
Two modes are used:
Mode 1: Charging (from grid/plant → storage).
Mode 2: Discharging (from storage → grid/plant).
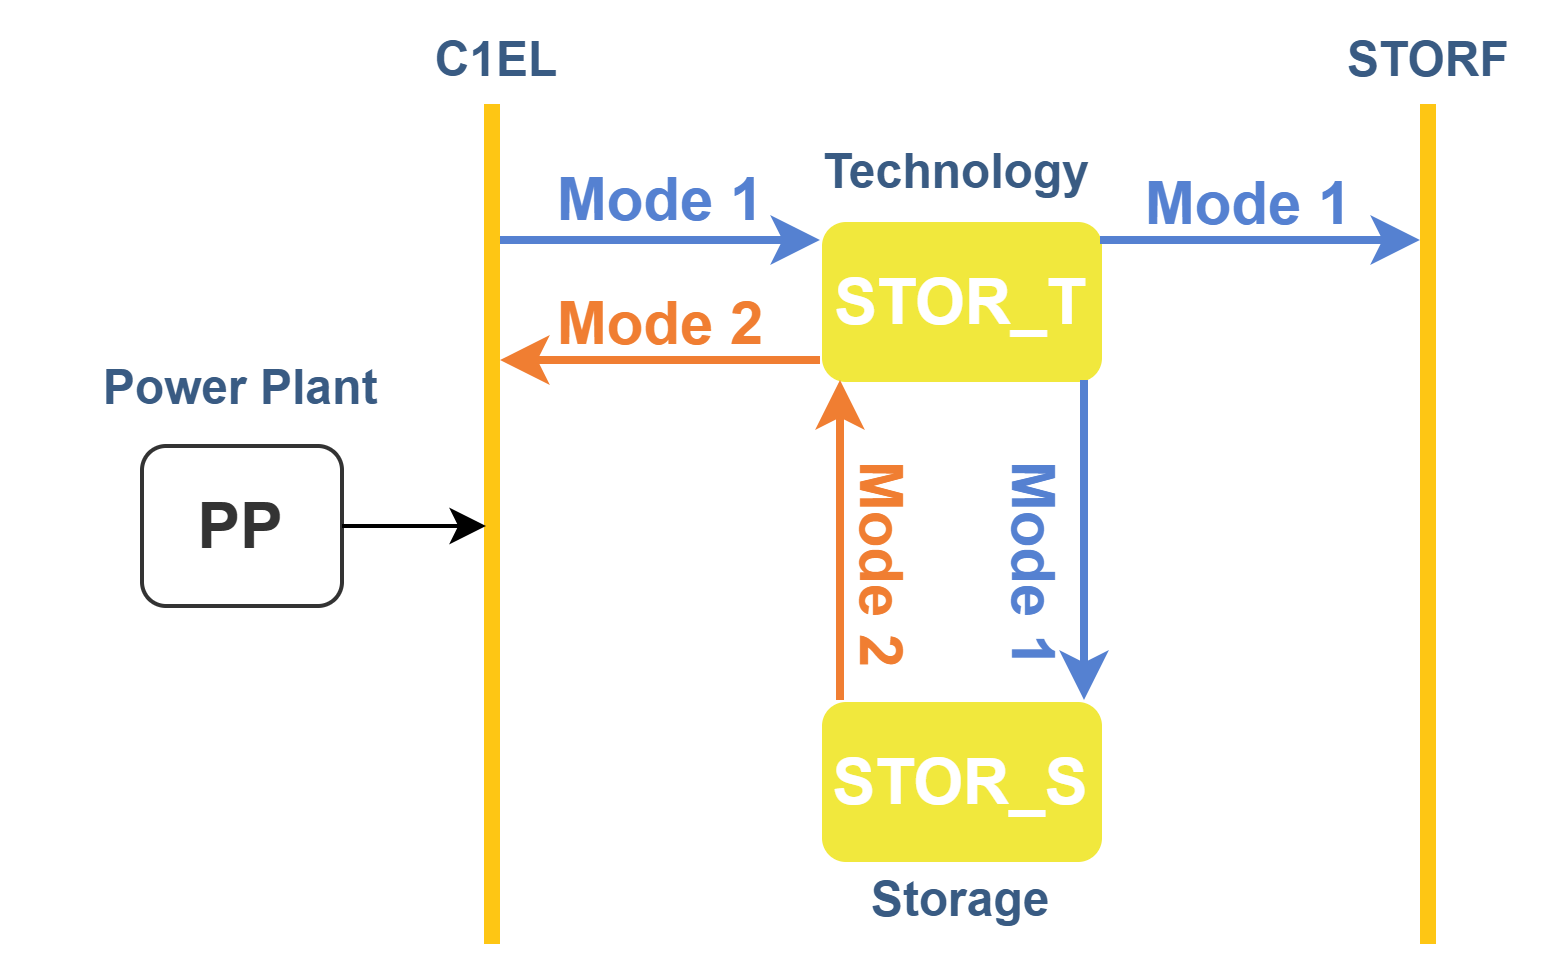
Figure 4. Storage Infrustructure.
Natural Gas Network Structure
The model represents natural gas flows through pipelines, LNG terminals and domestic extraction technologies.
Pipelines are modeled as bidirectional links (Mode 1 = export, Mode 2 = import).
LNG imports and exports are included as separate technologies.
Domestic extraction is captured explicitly via NG00X00 technologies.
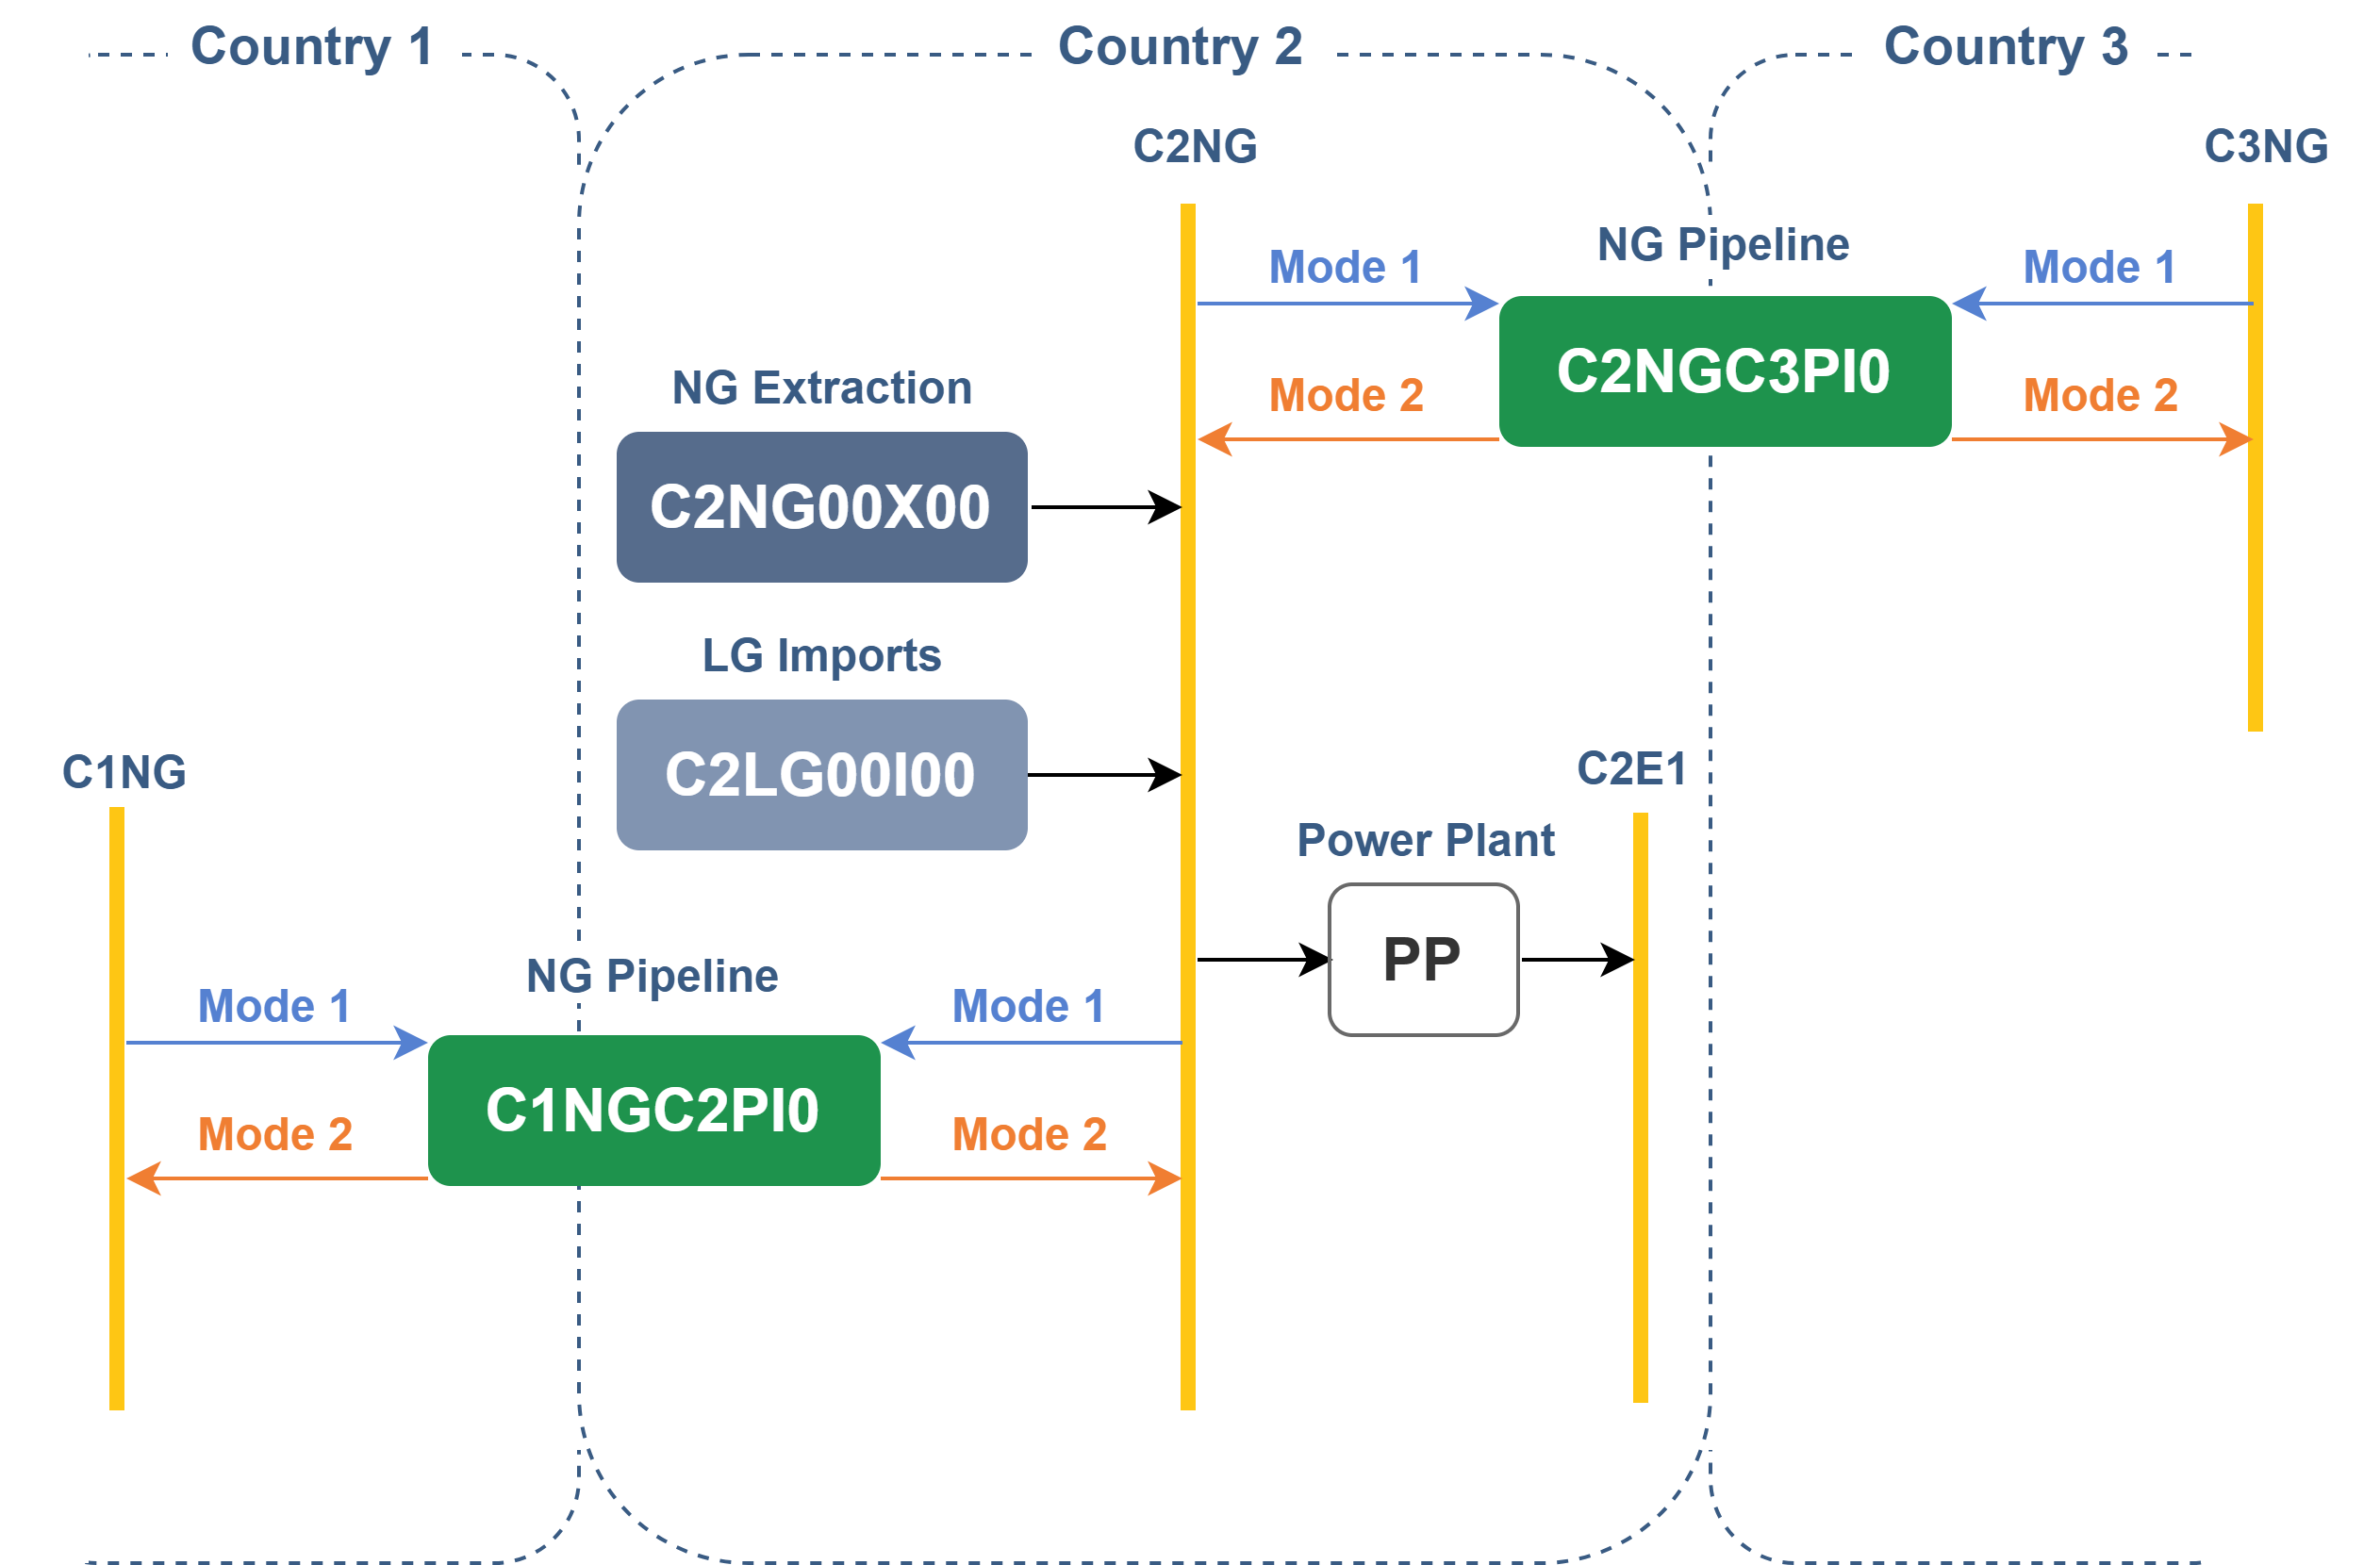
Figure 5. Natural Gas System Infrustructure.
Naming Manual
This manual explains the AETOS naming conventions for technologies, fuels, backstops, and infrastructure. Codes are systematic, compact, and interpretable, ensuring reproducibility and transparency.
Technologies
Technology Structure
COUNTRY FUEL TECHNOLOGY CLASS
Fuel Codes
Fuel Code |
Fuel Name |
|---|---|
NU |
Nuclear |
CO |
Coal |
LI |
Lignite |
NG |
Natural Gas |
SO |
Solar |
WI |
Wind |
HYD |
Hydropower |
BM |
Biomass |
BATT |
Battery |
WS |
Waste |
DG |
Derived Gas |
HF |
Fuel Oil / Heavy Fuel |
LF |
Light Fuel |
RG |
Refinery Gas |
DS |
Diesel Oil |
GO |
Geothermal |
TID |
Tidal |
OCWV |
Ocean / Wave |
Technology Codes
Tech Code |
Description |
|---|---|
CHP |
Combined Heat & Power |
STP |
Steam Turbine Plant |
CCP |
Combined Cycle Plant |
GCP |
Gas Turbine Plant |
GCC |
Gas Combined Cycle |
HPF |
Internal Combustion Engine |
CCS |
Carbon Capture Storage |
ON |
Wind Onshore |
OF |
Wind Offshore |
UTP / U1P |
Solar Utility Plant |
STH / C1P |
Solar Thermal |
MP / MS |
Hydro Reservoir |
SP |
Pumped Storage |
RP |
Hydro Run-of-River |
RCP |
Reciprocating Engine |
CVP |
Geothermal |
SCP |
Sub-critical Pulverised Coal |
NDP |
Wind (Africa) |
Class Codes
Class Code |
Meaning |
|---|---|
H1 |
Historical |
N1 |
New |
Example
CY SO UTP H1 = Cyprus, Solar Utility Plant, Historical
Backstops
Backstops Structure
COUNTRY BACKSTOP_TYPE
Backstop Codes
Backstop |
Meaning |
|---|---|
BACKSTOP |
Technology capacity issues |
CO2BACKSTOP |
Emissions issues |
NGBACKSTOP |
Natural gas supply issue |
Example CY CO2BACKSTOP = Cyprus, CO₂ emissions backstop
Feed-in Fuel Technologies
Feed-in-Fuels Structure
COUNTRY FUEL 00I00
Example CY NG 00I00 = Cyprus, Natural Gas Import node
Transmission
Transmission Structure
COUNTRY EL00T00
Example CY EL00T00 = Cyprus, Electricity Transmission
Distribution
Distribution Structure
COUNTRY EL00D00
Example CY EL00D00 = Cyprus, Electricity Distribution
LNG Imports
LNG Imports Structure
COUNTRYLG00I00
Example CY LG00I00 = Cyprus LNG Import
LNG Exports
LNG Exports Structure
COUNTRY LG00E00
Example CY LG00E00 = Cyprus LNG Export
Natural Gas Extraction
Natural Gas Extraction Structure
COUNTRY NG00X00
Example DZ NG00X00 = Algeria, NG Extraction
Natural Gas Pipelines
Natural Gas Pipelines Structure
COUNTRY1 NG COUNTRY2 PI0
Example DZ NG IT PI0 = Algeria → Italy NG Pipeline
Grid Interconnections
Grid Interconnections Structure
COUNTRY1 EL COUNTRY2 PH1
Example AO EL NA PH1 = Angola ↔ Namibia Electricity Interconnection
Storages
Storage Structure
COUNTRY STORAGE_TYPE CLASS
Storage Code |
Description |
|---|---|
BATT |
Battery Storage |
HYDSP |
Hydrogen Storage |
HYDSS |
Hydro Reservoir Storage |
Example MA BATT N1 = Morocco, Battery, New
Fuels
Fuels Structure
COUNTRY FUEL
Fuel Codes
Fuel Code |
Description |
|---|---|
E1 |
Electricity Transmission |
E2 |
Electricity Distribution |
E3 |
Electricity Supply |
BATF |
Battery Fuel |
NGE |
Natural Gas Export |
Example CY E1 = Cyprus, Electricity Transmission
Emissions
Emissions Structure
COUNTRYCO2
Example CY CO2 = Cyprus, CO₂ emissions